
U.S. convenience stores experienced a 15th straight year of record in-store sales and a 4th straight year of 10 billion-plus dollars in pretax profits, according to newly released NACS State of the Industry data.
Convenience stores sales overall surged 9.3 percent to 601.1 billion dollars, led by a 14.9 percent increase in fuel sales. Convenience stores sales overall are 3.2 percent of the overall U.S. gross domestic product of 18.57 trillion dollars (2016 data). Put another way, one of every 30.9 dollars spent in the country was spent at a convenience store in 2017.
The sales increase at convenience stores in 2017 was largely because of higher gas prices in 2017.
In-store growth powered by foodservice
Meanwhile, in-store sales increased 1.7 percent to a record 237.0 billion dollars. The last time the U.S. convenience store industry reported a decrease in in-store sales was 2002, when sales dropped 2.4 percent.
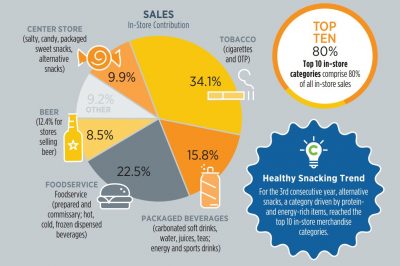
Foodservice, a broad category that mostly includes prepared food (69 percent of both category sales and profits) but also commissary foods and hot, cold and frozen dispensed beverages, continues to be a key focus for growth in the convenience store channel.
Foodservice sales overall in 2017 were 53.3 billion dollars, accounting for 22.5 percent of in-store sales in 2017 and 33.9 percent of gross profit dollars. The category also was the biggest differentiator in terms of profits: top-quartile performers had prepared food sales that were 3.6 times greater than bottom-quartile stores; coffee sales at top performers were 5.2 times greater that than those of the bottom quartile.
More op in-store categories
While tobacco products, including cigarettes, cumulatively were 34.1 percent of in-store sales dollars, they accounted for only 17.1 percent of gross profit dollars. Convenience stores sell 23.8 percent of packaged beverages in the United States according to Nielsen and saw a slight 0.4 percent sales increase in 2017. The trend continues: consumers are seeking more healthier and/or functional beverage options at convenience stores.
© NACS
Snacking categories all had sales growth, as salty snacks (up 5.6 percent), candy (up 2.6 percent) and alternative snacks (up 2.0 percent) all had strong growth as some consumers, especially millennials, moved toward snacking and away from traditional meals.
Operating Expenses
Despite record in-store sales, direct store operating expenses (DSOE) – encompassing wages, payroll taxes, health-care insurance, card fees, utilities, repairs/maintenance and supplies, as well as several other categories including franchise fees and property taxes – outpaced inside gross profit dollars for the second consecutive year. This trend continues to create challenges for convenience retailers as they look to grow their businesses.
Turnover for store associates was 115 percent, down from 133 percent in 2016 but a huge increase from the 73 percent that was reported in 2010 when unemployment was much higher because of the Great Recession. The rise is primarily due to tighter labor markets resulting from being in the seventh year of economic recovery. Turnover for store managers was only 18 percent, down from 27 percent the year prior.
Source: National Association of Convenience Stores (NACS)